From Legacy Network Billing Architecture to an eBPF-Based Solution
A deep dive into redesigning a network billing system using eBPF, replacing a legacy flow-based architecture with a lightweight, scalable, and Prometheus-native solution.
Introduction
Cloud infrastructure providers handle massive volumes of network traffic generated by virtual machines, managed services, and public networking components. Accurately measuring this traffic is critical for building a fair and reliable billing system.
Designing such a system is challenging. Traffic accounting pipelines must operate at high throughput while maintaining accuracy, low latency, and operational simplicity. Traditional approaches often rely on technologies such as NetFlow collectors, message brokers like Kafka, and multiple aggregation layers to process network usage data at scale.
Over the years, we implemented several generations of billing infrastructure based on these approaches. While these systems worked reasonably well, they introduced operational complexity, scaling limitations, delayed visibility, and accuracy challenges under heavy traffic conditions.
To address these limitations, we migrated to an eBPF-based architecture that performs traffic accounting directly inside the Linux kernel. This significantly simplified our data pipeline while improving accuracy, scalability, and real-time visibility.
In this article, we compare our legacy architecture with the new eBPF-based design, and describe how eBPF helped us build a more efficient and reliable network billing platform.
Legacy Architecture
The legacy billing architecture consisted of multiple components working together to collect, process, and store network usage data across the infrastructure. Each layer in the pipeline was responsible for a specific part of the traffic accounting workflow, from packet capture and flow generation to aggregation and long-term storage. In the following sections, we briefly describe the role of each service in the overall architecture.
Traffic Export Layer
At the traffic export layer, we used softflowd to generate NetFlow records directly from Linux network interfaces. Softflowd continuously monitored network traffic on compute and gateway nodes and converted packets into summarized flow records containing metadata such as source and destination addresses, ports, protocols, byte counters, and flow duration. This allowed the system to export compact traffic statistics instead of forwarding raw packet data through the billing pipeline.
Collection and Aggregation Layer
The exported NetFlow records were collected by pmacct / nfacctd, which acted as the central flow collection and aggregation layer. nfacctd received flow records from multiple servers, normalized the data, and performed initial aggregation before forwarding the results downstream. This layer also provided filtering and enrichment capabilities that helped standardize traffic accounting across different parts of the infrastructure.
Streaming Layer
After aggregation, the processed flow records were forwarded to Apache Kafka, which acted as the central streaming and buffering layer of the platform. Kafka decoupled traffic producers from downstream consumers and allowed the pipeline to handle large volumes of traffic data reliably. It also provided scalability, fault tolerance, and replay capabilities, which were important for operating the billing system in a distributed environment.
Processing Layer
To transform and prepare traffic records for indexing, we used Logstash as the processing layer. Logstash consumed messages from Kafka, parsed and enriched the records, and converted them into a format suitable for storage and analytics. This layer also handled filtering and normalization tasks required by the billing pipeline before the data was indexed.
Storage and Analytics Layer
Finally, processed traffic records were stored in OpenSearch for querying, aggregation, and long-term analytics. OpenSearch enabled us to build dashboards, generate billing reports, and perform traffic analysis across different infrastructure components. It also provided flexible search and aggregation capabilities that were useful for operational visibility and customer usage reporting. 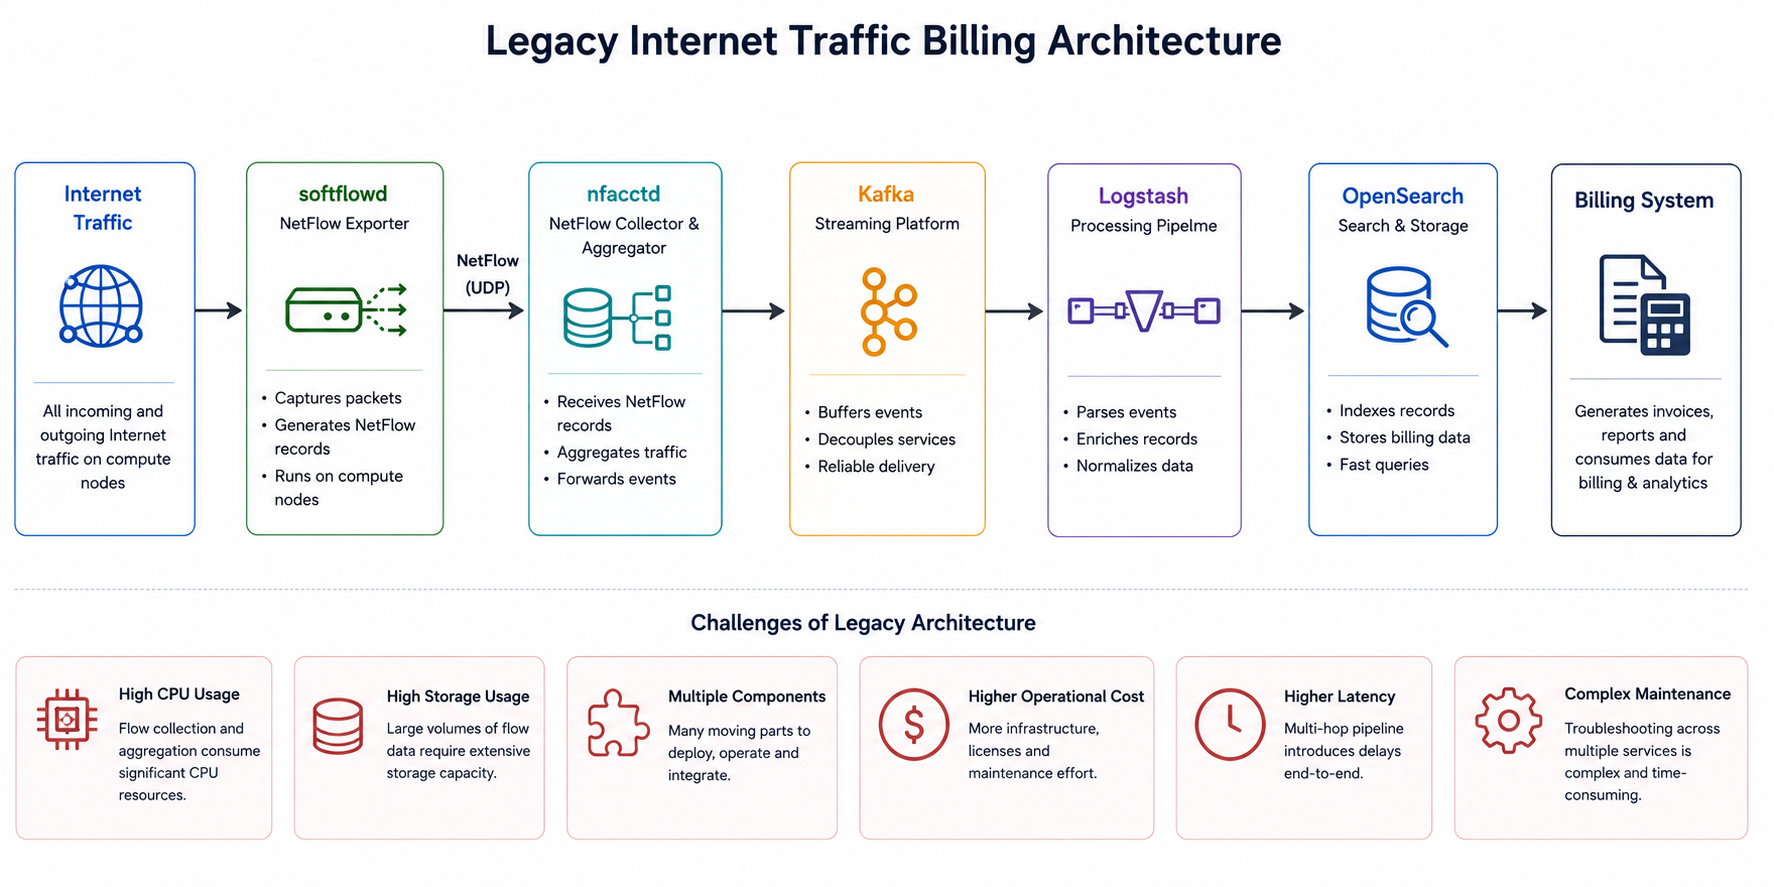
Issues with the Legacy Architecture
While the legacy pipeline worked reliably for a long time, operating it at production scale introduced several challenges. The overall architecture became increasingly resource intensive as traffic volume and the number of compute nodes grew.
One of the main challenges was the overhead on compute nodes. Since softflowd ran directly on hypervisors and compute servers, it consumed CPU resources for packet inspection and flow generation. In an IaaS environment, this meant fewer resources were available for customer workloads, especially under high utilization.
The downstream pipeline also required significant infrastructure resources. Apache Kafka needed substantial storage and memory to buffer high volumes of flow data, particularly during traffic spikes. Similarly, OpenSearch consumed considerable compute and disk resources for indexing and storing billing data.
Another challenge was the complexity of the overall pipeline. Traffic records passed through multiple layers of exporting, aggregation, streaming, processing, and indexing before becoming usable for billing and analytics. This increased operational complexity, introduced additional latency, and made troubleshooting more difficult when issues occurred within the pipeline.
Although this architecture provided flexibility and scalability, the operational cost and infrastructure overhead eventually motivated us to explore alternative approaches based on eBPF.
eBPF-Based Solution
To achieve a more scalable and efficient approach to network billing, we introduced an eBPF-based architecture for traffic measurement. Instead of relying on user-space flow exporters running on compute nodes, we now collect network telemetry directly from the Linux kernel using eBPF programs.
In this model, eBPF programs attached to kernel hooks collect network events and traffic statistics with minimal overhead. A user-space exporter reads the aggregated data from eBPF maps and forwards it to our pipeline, where metrics are stored and queried via Prometheus.
In the following sections, we describe each component of this architecture in detail.
eBPF Program
We use eBPF TC (Traffic Control) programs to capture ingress and egress traffic on specific network interfaces. TC programs allow us to observe and account for network packets at a precise point in the networking stack, which is required for accurate traffic measurement in the Network Calculator exporter.
Network Exporter
We built a Go-based exporter using the Cilium eBPF Go libraries and the Prometheus client library. The exporter runs in user space, reads data from eBPF maps, and exposes it over an HTTP endpoint in Prometheus format for scraping and integration with our billing pipeline.
Prometheus
We use Prometheus as a time-series database to store and query the metrics collected from our eBPF-based exporter. It enables efficient aggregation, querying, and monitoring of network traffic data used for billing and analytics.
eBPF programs internal
This section describes the internal design of the eBPF programs and how we collect both north-south and east-west traffic statistics.
North-South Traffic Maps
To track upload and download traffic for external network communication, we use eBPF maps to store per-IP traffic counters. Each entry contains the total ingress and egress traffic along with a timestamp indicating the last observed packet for that IP address.
For IPv4 traffic, we use a BPF_MAP_TYPE_PERCPU_HASH map to reduce lock contention and improve performance under high packet rates. The map key contains the IPv4 address, while the value stores upload and download byte counters.
1
2
3
4
5
6
7
8
9
10
11
12
13
14
15
16
struct ipv4_key {
__u32 ip;
};

struct traffic_volume {
__u64 download;
__u64 upload;
__u64 last_seen;
};

struct {
__uint(type, BPF_MAP_TYPE_PERCPU_HASH);
__uint(max_entries, 1024);
__type(key, struct ipv4_key);
__type(value, struct traffic_volume);
} internet_traffic_count_ipv4 SEC(".maps");
Using per-CPU maps allows traffic counters to be updated efficiently without heavy synchronization overhead between CPUs, which is important for maintaining low overhead on busy compute nodes.
North-South Traffic Accounting Logic
The TC programs are attached to both ingress and egress paths of the selected network interfaces. Each packet is inspected to determine whether it contains an IPv4 payload, and if so, the packet is forwarded to a shared accounting function responsible for updating traffic counters.
1
2
3
4
5
6
7
8
9
10
11
12
13
14
15
16
17
18
19
20
21
22
23
24
25
26
27
28
29
30
31
32
33
34
35
SEC("tc")
int internet_tc_ingress(struct __sk_buff *ctx)
{
    void *data = (void *)(long)ctx->data;
    void *data_end = (void *)(long)ctx->data_end;

    struct ethhdr *l2 = data;
    if ((void *)(l2 + 1) > data_end)
        return TC_ACT_OK;

    __u16 proto = bpf_ntohs(l2->h_proto);

    if (proto == ETH_P_IP)
        return internet_traffic_calc_ipv4(ctx, l2, data_end, 0);

    return TC_ACT_OK;
}

SEC("tc")
int internet_tc_egress(struct __sk_buff *ctx)
{
    void *data = (void *)(long)ctx->data;
    void *data_end = (void *)(long)ctx->data_end;

    struct ethhdr *l2 = data;
    if ((void *)(l2 + 1) > data_end)
        return TC_ACT_OK;

    __u16 proto = bpf_ntohs(l2->h_proto);

    if (proto == ETH_P_IP)
        return internet_traffic_calc_ipv4(ctx, l2, data_end, 1);

    return TC_ACT_OK;
}
The shared accounting function extracts the IPv4 header, determines whether the traffic is ingress or egress, and updates the corresponding upload or download counters inside the eBPF map.
1
2
3
4
5
6
7
8
9
10
11
12
13
14
15
16
17
18
19
20
21
22
23
24
25
26
27
28
29
30
31
32
33
34
35
36
37
38
39
40
41
42
43
44
45
46
47
static __always_inline int internet_traffic_calc_ipv4(
    struct __sk_buff *ctx,
    struct ethhdr *l2,
    void *data_end,
    __u8 type)
{
    struct iphdr *l3 = (struct iphdr *)(l2 + 1);
    if ((void *)(l3 + 1) > data_end)
        return TC_ACT_OK;

    struct ipv4_key key = {};

    if (type == 0)
        key.ip = bpf_ntohl(l3->daddr);
    else
        key.ip = bpf_ntohl(l3->saddr);

    __u64 bytes = ctx->len;

    struct traffic_volume *val =
        bpf_map_lookup_elem(&internet_traffic_count_ipv4, &key);

    if (!val) {
        struct traffic_volume init = {};
        bpf_map_update_elem(
            &internet_traffic_count_ipv4,
            &key,
            &init,
            BPF_NOEXIST);

        val = bpf_map_lookup_elem(
            &internet_traffic_count_ipv4,
            &key);

        if (!val)
            return TC_ACT_OK;
    }

    if (type == 0)
        val->download += bytes;
    else
        val->upload += bytes;

    val->last_seen = bpf_ktime_get_ns();

    return TC_ACT_OK;
}
For ingress traffic, the destination IP address is used as the accounting key because the packet is entering the instance. For egress traffic, the source IP address is used since the packet originates from the instance. The packet size is then added to the corresponding upload or download counter stored in the eBPF map.
East-West Traffic Maps
For east-west traffic accounting, we use the VXLAN protocol between compute nodes. Since VXLAN encapsulates tenant traffic using a unique VNI (VXLAN Network Identifier), we can extract the VNI from packets and use it to measure traffic per virtual network. To store these counters, we use another BPF_MAP_TYPE_PERCPU_HASH map keyed by the VNI and remote node IP address.
1
2
3
4
5
6
7
8
9
10
11
12
13
14
15
16
struct vni_key {
    __u32 vni;
    __u32 remote_ipv4;
};

struct vni_traffic_volume {
    __u64 inbound;
    __u64 last_seen;
};

struct {
    __uint(type, BPF_MAP_TYPE_PERCPU_HASH);
    __uint(max_entries, 1024);
    __type(key, struct vni_key);
    __type(value, struct vni_traffic_volume);
} vni_traffic_count SEC(".maps");
East-West Traffic Accounting Logic
To account for east-west traffic, the TC program inspects VXLAN packets and extracts tunnel metadata using the bpf_skb_get_tunnel_key() helper. This allows the eBPF program to identify the VXLAN Network Identifier (VNI) associated with each packet and attribute traffic to the correct virtual network.
1
2
3
4
5
6
7
8
9
10
11
12
13
14
15
16
17
18
19
20
21
22
23
24
25
26
27
28
29
30
31
32
33
34
35
36
37
38
39
40
41
42
43
44
45
46
47
48
49
50
51
52
53
54
55
56
57
58
59
60
61
62
63
64
65
66
67
68
69
70
71
static __always_inline int vni_traffic_calc(struct __sk_buff *ctx)
{
    void *data = (void *)(long)ctx->data;
    void *data_end = (void *)(long)ctx->data_end;

    struct ethhdr *l2 = data;
    if ((void *)(l2 + 1) > data_end)
        return TC_ACT_OK;

    // Only process IPv4 packets
    if (bpf_ntohs(l2->h_proto) != ETH_P_IP)
        return TC_ACT_OK;

    struct iphdr *l3 = (struct iphdr *)(l2 + 1);
    if ((void *)(l3 + 1) > data_end)
        return TC_ACT_OK;

    struct vni_key key = {};

    struct bpf_tunnel_key tkey = {};
    int ret = bpf_skb_get_tunnel_key(
        ctx,
        &tkey,
        sizeof(tkey),
        0);

    if (ret != 0)
        return TC_ACT_OK;

    key.vni = tkey.tunnel_id;

    if (!key.vni)
        return TC_ACT_OK;

    key.remote_ipv4 = tkey.remote_ipv4;

    __u64 bytes = ctx->len;

    struct vni_traffic_volume *val =
        bpf_map_lookup_elem(&vni_traffic_count, &key);

    if (!val) {
        struct vni_traffic_volume init = {};

        bpf_map_update_elem(
            &vni_traffic_count,
            &key,
            &init,
            BPF_NOEXIST);

        val = bpf_map_lookup_elem(
            &vni_traffic_count,
            &key);

        if (!val)
            return TC_ACT_OK;
    }

    val->inbound += bytes;
    val->last_seen = bpf_ktime_get_ns();

    return TC_ACT_OK;
}

SEC("tc")
int vni_tc_ingress(struct __sk_buff *ctx)
{
    return vni_traffic_calc(ctx);
}

char __license[] SEC("license") = "GPL";
After extracting the tunnel information, the program uses the VNI and remote node IP address as the map key and increments the corresponding traffic counter using the packet length from the current skb context. 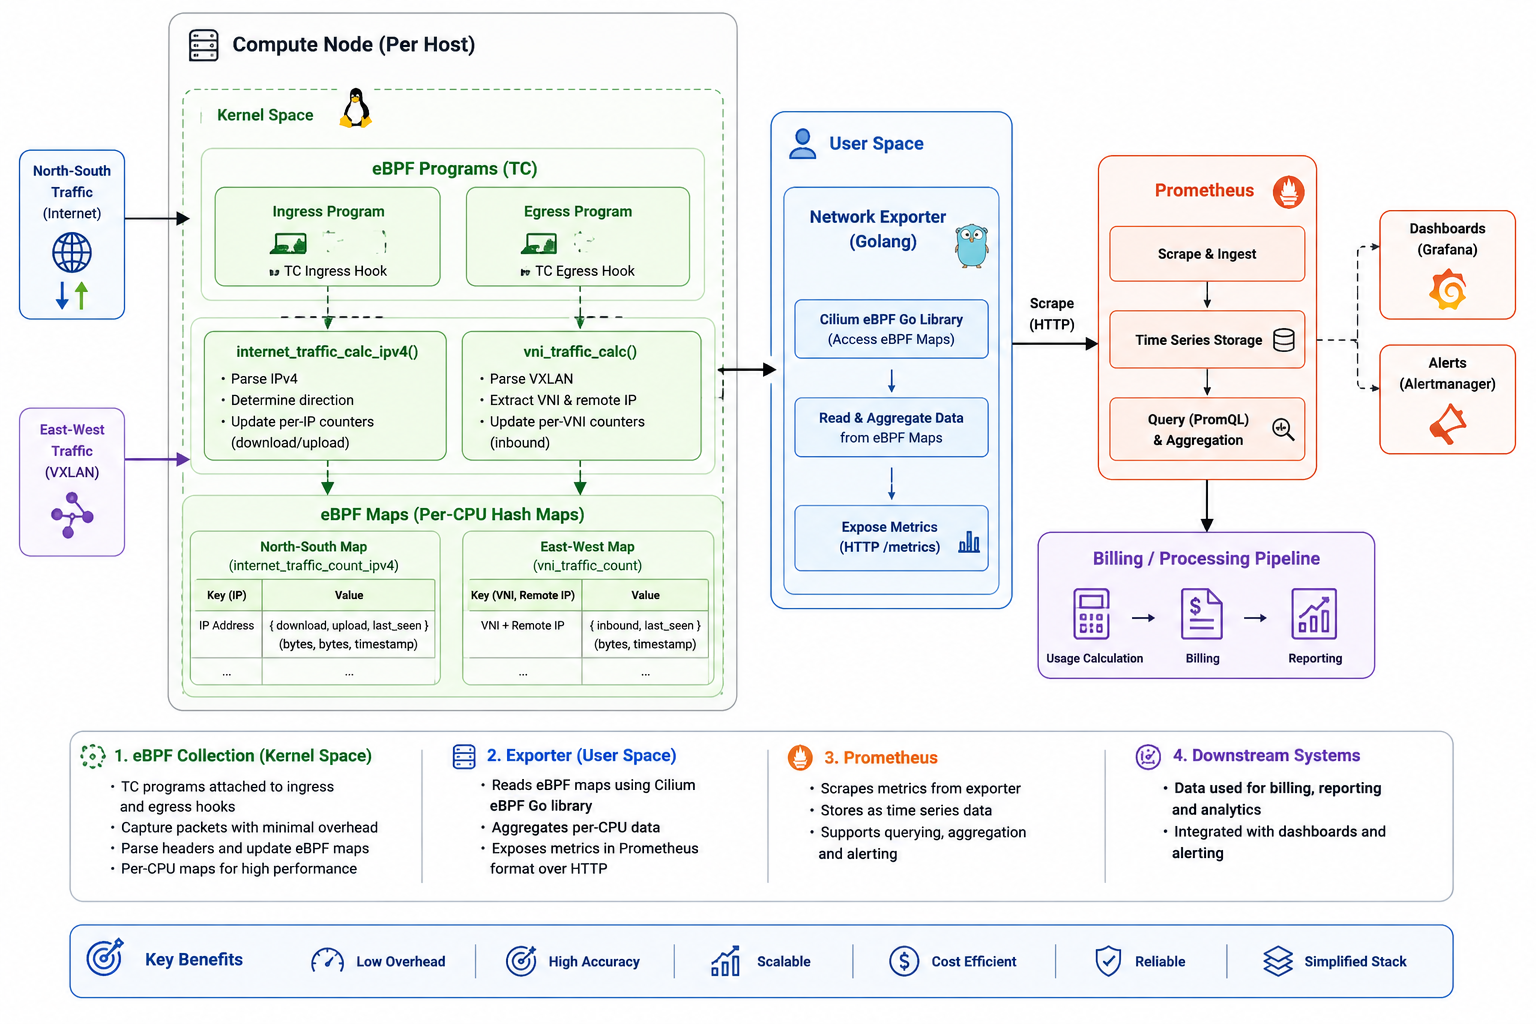
Conclusion
By adopting eBPF, we redesigned our network billing and monitoring infrastructure into a simpler and more consistent architecture based on lightweight exporters and Prometheus. This significantly reduced the operational complexity and maintenance overhead introduced by the previous multi-stage pipeline.
Moving traffic accounting directly into the Linux kernel also reduced the infrastructure resources required for packet processing, aggregation, and storage. By eliminating several intermediary services from the data path, we achieved a more efficient and reliable solution while improving scalability and traffic visibility across the platform.
Our experience showed that eBPF provides a powerful foundation for building high-performance network accounting systems with minimal overhead, especially in large-scale cloud environments where efficiency and accuracy are critical.